When displaying grid profiles, sometimes you need to combine your data in one display that includes multiple scales. In this post, I'll review an option that makes it easier to deal with this challenge. Using Target or the Oasis montaj Drillhole extension, you can add profiles to section maps.

Depending on the scale of your section and the page size you are working with, it can be difficult to see subtle features in the gridded data. If this is the case, it is helpful to know that there is another way to see the profiles of gridded data along a section.
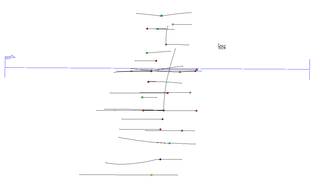
1. Plot the section trace on a plan map
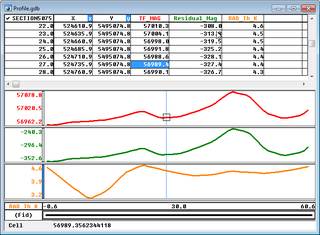
2. Use Grid Profile to save various grid values along the trace to a new line in a new or existing database. I prefer a *new* database as there will be a new channel for each grid.

3. Display the profiles for each channel and customize the visualization of the profile to your preference. (To do this, right click on the profile and select Profile Options...)
4. Right click and select Plot Profile Figure...

and this will display your grid profiles along the section in a new map.
