Extensions for Target and Oasis montaj
256-Channel Radiometrics Processing
Adds advanced geochemical analysis and QA capabilities to Target and Oasis montaj. This extension enables you to effectively import, validate and analyze your surface geochemical data.
Validating geochemical assay data requires standards and duplicate samples that must be extracted and analyzed to ensure that batch results fall within statistical limits.
The montaj Geochemistry extension helps you perform essential tasks for due-diligence and reporting. The extension includes QA/QC tools to confirm the validity and quality of geochemical data, including assay, standards and location data acquired in surveys.
The extension also provides a full range of symbol and grid display and map making functions, which include CAD tools for editing and the creation of interpretations.
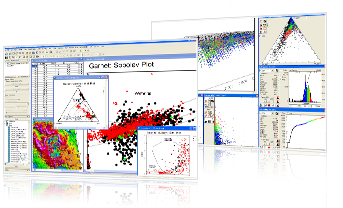
The full suite of easy to use geochemical analysis functions includes summary statistics, histograms, scattergrams, tri-plots, principle component analysis, probability analysis and correlation plots.
Kimberlite Indicator Mineral Geochemistry Analysis
Included within the Geochemistry extension is SEMplot, a simple-to-use workflow for analyzing indicator mineral grain geochemistry within the Oasis montaj software environment. The SEMPlot workflow enables the import of the data, mineral identification of the grain based on its chemistry, display of the selected grains on the discriminating graphs and interactive re-classification.
Standard published graphs are included. Users are also able to create their own graphs and overlays. Users may use the raw data, cation, recast, Fe normalized or Fe corrected data stages. The built in OM Dynamic linking ensures the spatial context between the grain graphs, database and maps is maintained. Watch the SEMplot video.
Overview of Geochemistry:
- Simplify the quality control process with easy-to-use standard and duplicate handling capabilities
- Analyse multi-element geochemistry with interactive histograms, scatter plots, probability and ternary plots to identify outliers and populations
- Select and subset data interactively from maps based on rock codes, regions or map groups
- In diamond exploration, effectively discriminate samples of interest based on their indicator mineral grain geochemistry
- Identify geochemical trends and anomalies quickly and efficiently
- Enhance your maps with advanced symbol plotting and data gridding techniques
- Combine surface geophysics, geology and geochemistry data into dynamically linked maps
Geochemistry
Extensions for Oasis montaj

The montaj 256-Channel Radiometrics Processing extension enables geoscientists to process and visualize 256 channel spectrometer data. There are three main phases in airborne spectrometer survey data handling are acquisition, processing and presentation. This extension is designed specifically for processing raw data collected from airborne surveys.
In addition to radiometric processing capabilities, this extension provides 1D non-linear filters to locate and remove data that is recognized as noise.
Overview of 256-Channel Radiometrics Processing:
Import full spectra (i.e. arrays) of radiometric data using an Import Wizard
Display full "spectra" as profiles in a column of the database
View individual windows of spectra in database columns
Window K, Ur, Th and Total Count values simultaneously and store in unique columns
Window individual K, Ur, Th and Total Count values individually and store in a column
Subset spectra using sample ranges (i.e. to evaluate sub-windows) within individual spectra
Process windowed data using the standard reduction capabilities in the RPS system
Apply 1D Non-Linear Filter to remove very short wavelength, but high amplitude features from data
Airborne Quality Control

The montaj Airborne Quality Control extension provides essential tools for planning an airborne survey, and meeting basic tender specifications.
The extension includes flight path planning tools, the ability to monitor the survey progress, and streamlined quality control (QC) tools.
The Flight Path Planning creates a flight line plan tailored to the shape and size of the survey area. Boundary maps of the survey area can be imported from an AutoCAD DXF file or digitized as polygon files. Planning controls specify the direction, starting reference point, and distance between flight lines for the airborne survey area.
The QC statistical tool generates and prints a statistical report for meeting tender or operational specifications. A built-in mapping wizard automatically displays QC results.
Quality control functions provide the ability to perform tests for altitude deviation, flight path deviation, flight line separation, sample spacing, diurnal drift and magnetic noise.
Overview of Airborne Quality Control:
Generate flight path map of planned survey.
Display survey statistics.
Display survey line distance.
Create intersection tables.
Perform altitude deviation QC test.
Perform flight path deviation QC test.
Perform flight line separation QC test.
Perform sample spacing QC test.
Perform diurnal drift QC test.
Perform magnetic noise QC test.
Map and print QC results.
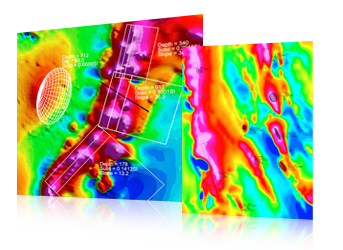
Depth to Basement

The Depth to Basement extension to Oasis montaj provides an automated method for determining the position (i.e., distance along the profile and depth), dip (i.e., orientation) and intensity (e.g., susceptibility) of magnetic source bodies for a magnetic profile. With large, distinct density contrasts, the extension can also be used on gravity profiles to determine the position of gravity source bodies.
The extension includes three different depth to basement techniques: Werner Deconvolution, Analytic Signal and Extended Euler Deconvolution. Each Depth to Basement function utilizes a different accepted technique for determining the depth to the source. Each function has advantages in particular geologic situations. Applying several functions to the same geology greatly improves the reliability of results.
Solutions are saved in an Oasis montaj database (GDB), allowing you to immediately view the results in profile, edit the solutions, and plot the solutions on 2D and 3D maps. Additional functions also enable you to cluster solutions, export solutions to GM-SYS models, and generate starting GM-SYS models from data profiles.
Werner Deconvolution
Werner Deconvolution is an automated function for determining depth to source from profiles. It is based on the popular Werner Deconvolution technique (Werner, 1953; Ku & Sharp, 1983)
The user can control Werner's parameters in order to customize the application to each situation. The Werner Deconvolution GX will calculate the horizontal derivative or you may provide your own pre-calculated horizontal derivative for greater control. The adjustable "Residual cut-off" parameter enables the user to control the separation of "signal" from noise. The Werner Deconvolution GX assumes the source bodies are either dikes or contacts with infinite depth extent and uses a least-squares approach to solve for the source body parameters in a series of moving windows along the profile. The user specifies both the range of window sizes and the increments between window placements, thereby maximizing solution accuracy.
Analytic Signal
Analytic Signal is an automated function that enables you to determine Analytic Signal depth solutions from gravity and magnetic profiles. The Analytic Signal function is based on the U.S.G.S. program PDEPTH (Phillips, 1997), which is based on the Nabighian method published by Misac Nabighian. (1972, 1974).
The input profiles are interpolated to an even sample interval using the standard Oasis spline method before processing by the Analytic Signal GX. The sample interval is the total profile length divided by the number of points in the profile. Therefore, profiles with large gaps should be split into multiple lines.
The Analytic Signal technique first calculates the analytic signal of the input profile using a Hilbert Transform. Local peaks in the Analytic Signal profile are interpreted as corners of source bodies and the shape of the peak contains information about the depth to the corner. In the absence of high-frequency noise and aliasing in the data, horizontal locations from Analytic Signal are highly accurate.
For noisy input profiles, the results can be improved significantly by filtering the input anomaly and gradient data. The Analytic Signal GX uses a FFT technique to calculate the horizontal derivative if the user does not specify an input gradient channel.
Extended Euler Deconvolution
Extended Euler Deconvolution is an automated function for determining the depth to source from profiles. It is based on the the paper by Mushayandebvu and others, (2001).
The Extended Euler Deconvolution function calculates the horizontal and vertical derivative profiles or you may provide your own. If your input profiles are noisy, you can improve the performance of Extended Euler significantly by filtering or smoothing the profiles before running Extended Euler.
The number of solutions generated are controlled by four parameters. The "Min." and "Max." Depth parameters set the minimum and maximum depth cut-off values. The "Window Length" parameter sets the length of the Extended Euler operator, which is moved across the profile and used for each calculation. The "Max % error" parameter filters out solutions that differ in depth by more than this % when calculated by both Euler and Extended Euler calculations.
The Extended Euler calculation routine used in this tool was provided by GETECH and is based on the paper by Mushayandebvu and others, (2001). This approach calculates solutions using both the conventional Euler equation, Reid and others, (1990) and the "rotational constraint" equation from Extended Euler. Solving both equations jointly (Extended Euler) gives distance, depth, dip and susceptibility, assuming there is no remnants magnetization. Using conventional Euler gives a second estimate for distance and depth. If the relative difference in depth for the two estimates is less than the Max % error given by the user, the solution is retained; otherwise it is rejected.
References
Mushayandebvu, M. F., van Driel, P., Reid, A.B., and Fairhead, JD., 2001, Magnetic source parameters of two dimensional structures using extended Euler deconvolution: Geophysics, vol.66, no.3, p814-823
Reid, A.B., Allsop, J.M., Grasner, H., Millet, A.J., and Somerton, I.W., 1990, Magnetic
Drillhole Plotting

The montaj Drillhole Plotting extension enables quick, easy and accurate production of presentation-quality drillhole section and plan maps. Drillhole data can be presented in a 3D space within the Oasis montaj environment.
This extension enables geologists to set up drill projects, manage results dynamically, and interpret results for follow-up drilling and decision-making.
The extension enables you to create plan, section, stacked section and 3D visualizations. A Strip Log and Compositing tool is also provided for displaying up to 16 strip log plots per map, and for calculating and annotating composite intervals on plotted strip logs.
Overview of Drillhole Plotting:
Process and analyze large volume drillhole data.
Import directly from an acQuire database management system.
Create data validation QA/QC reports.
Quickly select your holes of interest.
Create drillhole plans, sections and strip logs.
Visualize borehole and drillhole data from different angles in true 3D space.
Produce high quality maps for interpretation and target definition.
Generate and manage exploration drilling projects.
Geophysics

The montaj Geophysics software extension provides a range of filters and statistical tools for working with large-volume geophysical data.
Spatial 1D Filters enable field geophysicists to process data by applying a variety of space domain filters (linear and non-linear).
The 1D FFT Filter enables you to apply a variety of Fourier domain filters to one-dimensional (line) potential field and other data.
A variety of geostatistical tools provide the ability for summary and advanced statistics, including histogram, scatter and triplot analysis, and the ability to subset data based on code or map group classification.
Overview of Geophysics:
Smooth data, with or without non-linear filtering, using spatial one dimensional filters.
Apply convolution filters, including Difference, Fraser, Laplace, Low-pass, Band-pass, High-pass, and User-Defined.
Enhance the shorter wavelength features in the data using one-dimensional Fast Fourier Filters (FFT). These include regional filters, upward/downward continuations and vertical and horizontal derivatives.
Apply Lag Correction to a channel of data by shifting the start fiducial by a specified lag amount.
Apply Heading Correction to data for a systematic shift (in the data) that is a function of the direction of travel for a survey line.
Apply Magnetic base station correction to a magnetic channel.
Perform profile-based processing for interpretation and modelling purposes.
Perform multivariate analysis using histogram, scatter and triplot statistical analysis tools Select and subset data interactively from maps based on text codes, regions or map groups.
Create sections from survey lines that contain bends or curves. Display these curved or crooked sections in 2D or 3D views as either grids or pixel plots.
Minimize edge effects with the Constrained Linear Prediction (CLP) extrapolation method, added to the 1D-FFT expansion routine, when working with data containing systematic high frequency interference.
Integrate seismic data in SEG-Y format with Oasis montaj geospatial data. Convert 2D SEG-Y data into bitmaps, Oasis montaj grids or databases and 3D SEG-Y data into 3D Grids or databases.
Geophysics Levelling

The montaj Geophysics Levelling extension includes advanced tools for processing and enhancing airborne magnetic and other geophysical data. It provides a step-by-step methodology for accomplishing a variety of levelling and correction tasks.
A Microlevelling toolkit enables you to perform microlevelling corrections on line-based data.
With the Iterative Levelling option, you can optimize the identification and correction of errors in geophysical data. The Iterative Leveling option will repeat the process of levelling ties to flight lines, then flight lines to ties, until the process converges.
Overview of Geophysics Levelling:
Evaluate Data for Systematic Error and Noise.
Correct Systematic Errors in Geophysical Data (magnetic base station, lag, heading, and IGRF corrections).
Find and Edit Intersections (between any lines in a dataset).
Perform Statistical Levelling of Tie Lines (lines can either be regular survey lines and tie lines.
Perform Full and Careful Levelling of Survey Lines.
Perform microlevelling corrections on line-based data.
Remove any low amplitude component of flight line noise still remaining in airborne survey data after tie line levelling.
Minimize or remove different survey parameters, noise levels, or uncertainties at the grid edges, to create more seamless grid compilations and identify subtle geophysical anomalies.
Gravity and Terrain Correction

The montaj Gravity and Terrain Correction software extension provides a complete system for processing and reducing gravity data from conventional ground surveys.
Apply terrain corrections from digital elevation models (DEMs) or gridded elevation data. With the streamlined menu system, perform all the standard gravity processing steps quickly and easily. In addition, the uniquely optimized terrain reduction algorithm delivers accurate corrections quickly, even for very large data sets.
Geosoft's terrain correction algorithm combines methods described by Kane and Nagy with advanced grid-mesh interpolation, zoning and de-sampling technique.
Overview of Gravity and Terrain Correction:
Correct base station data.
Manipulate calibration data.
Merge X and Y location data with survey data.
Apply drift and atmospheric tide corrections.
Compute free air and Bouguer anomaly values, and computing terrain corrections.
Gravity processing and reduction functions.
Access data manipulation utilities.
Process data in UTM coordinates and many other cartographic projections.
Reduce data from local grid surveys, and regional longitude, latitude based surveys.
Handle Base Station loop and Calibration surveys.
Create statistical reports to evaluate repeat readings.
Apply water and ice corrections to the Bouguer anomaly.
Apply Terrain correction able to Regional and residual DEM grids of any size.
Export for modelling.
Gravity and Magnetic Interpretation

The montaj Gravity and Magnetic Interpretation extension software includes Euler 3D Deconvolution processing routines to automatically locate and determine depth for gridded magnetic and gravity data.
Euler 3D automates 3D geologic interpretation by delineating magnetic and gravimetric boundaries and calculating source depths.
The extension also includes the Keating Magnetic Correlation Coefficients function used in Kimberlite Exploration. This tool uses a simple pattern recognition technique to locate magnetic anomalies that resemble the response of a vertical cylinder model typical of Kimberlite pipes.
A Source Edge Detection (SED) tool is included for locating edges (e.g. geological contacts) or peaks from potential field data by analyzing the local gradients.
The Source Parameter Imaging (SPI) tool automatically calculates the depth of magnetic sources from a gridded magnetic dataset. The depths are displayed as a grid and are based on source parameters of the following source models : contacts (faults), thin sheets (dikes) or horizontal cylinders.
Overview of Gravity and Magnetic Interpretation:
Locate and determine depth rapidly for large amounts of area data.
Apply FFT and convolution grid enhancement and processing routines to calculate X and Y derivative grids.
Display Total Field and Derivative grids for analysis.
Analyze grids (perform Euler source inversion).
Choose a structural index (any real value between 0.0 and 3.0).
Display solutions in Oasis database and search large areas for similar targets.
Perform and display solution statistics.
Display/Plot database solutions.
Window and plot solutions (based on location uncertainty and offset) to extract the solutions you consider relevant and remove erroneous solutions.
Apply Keating Magnetic Correlation Coefficients tool for locating magnetic anomalies that resemble the response of modeled Kimberlite pipes.
Apply Source Edge Detection tool for locating edges (i.e. geological contacts) or peaks from potential field data by analyzing the local gradients.
Apply Source Parameter Imaging (SPI) tool for quickly and easily calculating the depth of magnetic sources. SPI and Source Parameter Imaging are trademarks of Geoterrex.
Automatic or interactive stitch selection. Automatic option runs via intelligent defaults.
Blending or suturing method selection.
Pre-processing: 0, 1st, 2nd and 3rd order trend removal and trend area specification (overlap, all, edge points or overlap edge points).
Pre-processing: Regional trend removal.
Pre-processing: interpolation, maximum gap and output cell size specification.
Suture and weighting options (ensures a smooth transition between grids).
Stitch up to 10 grids together (or up to 20 using a script) in a single operation.
Stitch up to 10 grids together (or up to 20 using a script) in a single operation.
Remove static, slope, 2nd and 3rd order trends.
Calculate the trend using 'all points', 'overlapping points', 'edge points' and overlapping edge points.
Perform regional trend removal. With the "to a regional grid" method, trend removal operations are performed with respect to a regional grid. The maximum trend order may be specified, or adjusted automatically based on a fitting tolerance.
Process time-domain and frequency-domain data from dipole-dipole, pole-dipole.
Apply pole-pole and gradient survey configurations.
Handle different instruments and arrays.
Reduce raw IP data.
Perform interactive quality control.
Add topographic information.
Plot pseudo-sections.
Plot values in pseudo-section format.
Plot stacked pseudo-sections.
Apply Pseudo-section Tool for IP quality control.
Create 3D views of stacked sections.
Apply two dimensional Fast Fourier Domain filters (FFT Filters) to gridded data.
Potential Field Filters.
Reduction of magnetic data to the magnetic pole or equator.
First/second/nth vertical derivatives, including fractional derivatives.
Upward/downward continuations to any horizontal surface.
Apparent magnetic susceptibility maps from magnetic field.
Apparent density maps from residual gravity field.
Optimum Weiner depth filter.
Conversion between different directional components of the field.
Apply General Purpose Filters.
Six different regional/residual separation filters.
De-corrugation and directional filters.
First/second/nth horizontal derivatives.
Texture Analysis - Highlights the locations of complex local textures often associated with discontinuities in magnetic data.
Phase Symmetry - Using the results of the texture analysis, detects any laterally continuous line-like regions of discontinuity.
Structure Detection - Using the phase symmetry results, reduces the regions containing discontinuities into skeletal structures detailed as a binary grid.
Phase Congruency Find edges in magnetic or gravity data irrespective of their orientation or contrast with the background.
Structure Detection Generate trend line estimates from the edge information detected by the phase congruency transform.
Quick access to new layers of information assist with the interpretation of magnetic and gravity data.
Rapid workflows aid productivity when creating a first pass unbiased view of the data.
Full scalability for use in regional scale or property scale data sets.
Versatile tools can be used on different data and in different ways.
Two workflows are included. The first method is suitable for analyzing regions of subdued magnetic or gravity responses where texture analysis can first enhance the local data contrast. The second method, edge detection, is useful in identifying linear discontinuities.
Provide rapid, objective and consistent analysis of magnetic data to automatically locate porphyry magnetic signatures.
Add a new tool to your workflow for interpreting magnetic data.
Tune the results based on target shapes and sizes of the porphyry systems.
Drape barometric or loose drape surveys to a tight drape.
Drape over the basement surface.
Transform drape-flown surveys to barometric.
Apply height corrections to minimize line-to-line effects.
Vary the Earth's magnetic inclination and declination to produce a grid that is reduced to the pole everywhere. The local inclination and declination of the earth's magnetic field can vary quite dramatically over large regional surveys. One value of inclination and declination will not satisfy the reduction to the pole operator at all places on the grid.
Calculate a total magnetic field grid from two horizontal gradient Hx and Hy grids (see technical reference below).
Highlight anomalies (e.g. kimberlites) with high gradients Reduce the survey cost by eliminating the need to collect tie lines.
Rapidly model a well-defined anomaly, either on a profile or a map, using a single body.
Model up to three gravity and magnetic components (simple or gradient) simultaneously.
Select from a broad range of body types including: rectangular prism; ellipsoid; sphere; polygonal prism (2D or finite length); cylinder (possibly with sloping end); slab (2D or finite length); dyke (2D or finite length).
Identify an anomaly in Oasis montaj, model it (including a depth and dip determination) and post the result back to an Oasis montaj map in less than a minute.
Work with multi-component down-hole data.
Include remanent magnetisation and anisotropic susceptibility.
Streamline your workflow by integrating your modelling with Oasis montaj.
A spectrum browser with tools for peak identification.
Window-based (ROI) processing following IAEA standards.
Advanced full-spectrum processing using least-squares fitting techniques.
Principal component (NASVD or MNF) analysis and spectrum processing.
Advanced support for radon removal including extended spectral-ratio and full-spectrum techniques.
Delineate one or more known targets to provide signatures. These may be from within the study area, from a different area or from synthetic models.
Apply neural network training to the known targets.
Apply neural network simulation to the study area, to locate signatures similar to the known targets.
Spesialized Processing
GridKnit

The montaj GridKnit extension enables geoscientists to rapidly and accurately merge virtually any pair of geophysical grids. GridKnit efficiently merges grids with different cell size, projection or grid type.
The blending method quickly merges grids via standard smoothing functions. The suturing method enables you to automatically or manually define a join path then applies a proprietary multi-frequency correction to eliminate differences between the grids along the path. "Postage stamp" stitching allows easy insertion of high-resolution grids into regional backgrounds.
A single wizard guides you through these steps:
Overview of GridKnit:
Induced Polarization

The montaj Induced Polarization extension performs a variety of tasks on your IP data including import, quality control, processing, gridding, and plotting. This extension is designed for both contractors and in-house geophysicists.
Import, perform basic quality control, process, and present data from both time and frequency domain surveys.
Import time-domain or frequency domain data in Zonge, Iris, Scintrex, Phoenix and Geosoft formats. Process data from dipole-dipole, pole-dipole, pole-pole, or gradient surveys.
Automatically calculate apparent resistivity, metal factor, IP, Self Potential and individual time slices. Evaluate duplicate samples with the unique quality control tool. Filter your data using standard pant-leg filters.
Produce pseudo-section presentations, including stacked sections, and instantly convert your stacked sections to display in three dimensions.
This extension also provides the ability to integrate IP data with third-party modelling results. The UBC 2D Model Import provides the ability to convert UBC 2D model files to a Geosoft grid file and display them on a map. With the UBC IP export, you can export RES or IP data for use in the UBC inversion program.
Overview of Induced Polarization:
Isostatic Residual

The Isostatic Residual extension to Oasis montaj uses a modified version of the USGS algorithm to calculate the Airy isostatic regional and residual gravity from a topographic grid.
The Isostatic Residual extension calculates a depth to the Moho (the "root") using the topographic grid, terrain density, Moho density contrast and depth of sea level compensation. It then calculates the 3-D gravity response of that root, at sea level, out to 166.7 km. The output must be combined with a solution beyond 166.7 km to make a complete Airy regional.
Use of Isostatic Residuals
The long wavelengths of the Bouguer gravity field correlate inversely with the long wavelengths of topography. Masses or "roots" at the base of the crust supporting the topography cause this correlation according to the theory of isostasy. These regional-scale anomalies are especially prominent in mountainous areas and near the edges of continents (i.e. continental shelves) and often obscure anomalies caused by upper crustal structures. Simpson et al., (1986) have shown this correlation analytically for the Conterminous U.S.; a qualitative comparison of the Bouguer anomaly and topography maps for other continents show this same correlation.
Polynomial fitting or wavelength-filtering techniques have been routinely used for the removal of topography-induced regional and the enhancement of gravity anomalies related to shallow geologic features. However, these techniques suffer from the fact that they eliminate all wavelengths longer than some threshold, whether of not they are related to topographic features In fact, long-wavelength anomalies due entirely to lateral variations in crustal density will be eliminated by these techniques. The isostatic correction is preferable because the isostatic regional accounts for the effect of the topographic "roots", thereby removing the observed correction between Bouguer values and topography. Isostatic residual gravity maps reveal more clearly than most gravity maps the density distributions within the upper crust that are of interest in most kinds of geologic and tectonic analyses.
The isostatic approach applies a consistent, 3-dimensional technique at virtually all scales for an entire continent including the continental margins. Additional geophysical data such as seismic refraction can be incorporated into the determination of the isostatic residual. The isostatic anomaly is based on an accepted geologic concept rather than a mathematical filter. The alternate methods can still be applied to the isostatic residual to remove regional trends not related to topographic loads.
MAGMAP Filtering

The montaj MAGMAP Filtering extension provides a 2D-FFT filter library to allow the application of common Fourier domain filters to gridded data in Oasis montaj.
MAGMAP rapidly processes and enhances gridded datasets by applying a wide range of robust geophysical and mathematical filters. The extension lets you define your own filters, modify the filter specific parameters and apply any number of filters together in a single operation.
It includes an Interactive Spectrum Filter that enables you to quickly preview filtered grids. The MAGMAP Interactive Spectrum Filter solution is a dynamic visual tool that provides an interactive slider allowing you to adjust filter parameters and preview the results instantly. With this tool, you can quickly preview how each filter enhances specific features you are considering before applying the filter to your entire grid.
Overview of MAGMAP Filtering:
CET Grid Analysis

The CET Grid Analysis extension provides a rapid unbiased workflow that reduces time when interpreting large volumes of gridded data.
The extension contains tools for texture analysis, phase analysis, and structure detection. These are versatile algorithms useful for grid texture analysis, lineament detection, edge detection, and thresholding.
Texture analysis-based image enhancement
Useful for highlighting local intensity variations, this method enhances regions of discontinuity within aeromagnetic/gravity datasets. Trends are found in the data by identifying regions of textural complexity in the local magnetic response before looking for axes of symmetry. Such axes are likely to be distinct linear discontinuities in the signal.
Regions of magnetic gravity discontinuity usually correspond with, and can reveal, lithology boundaries, faults, and dykes critical to understanding the geology of an area.
Using the texture analysis output, it finds the skeletal structure of the regions of the magnetic/gravity discontinuity. The output is a set of binary skeletal line segments that belong to each of the discontinuity regions, clearly showing the changes of orientations and offsets within the structures."
The process uses the following techniques:
Discontinuity structure detection
This approach applies phase-based edge detection directly to data to find edges whose noise characteristics and poor contrast limit the effectiveness of traditional gradient based approaches. As an alternative method of identifying linear discontinuities, edge detection can be performed directly on magnetic or gravity data. Using a phase-based approach will ensure that even features lying in low contrast regions will be detected.
This process emulates the traditional manual drawing of interpretive lines along the discontinuity. This includes:
Key benefits of CET Grid Analysis are:
CET Grid Analysis was developed by the Centre for Exploration Targeting (CET). It is licensed and distributed by Geosoft as an Oasis montaj plus third party extension.
CET Porphyry Detection
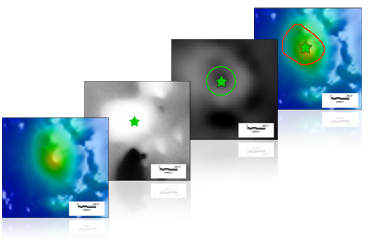
The new extension for CET Porphyry Detection was specifically designed to locate porphyry magnetic signatures. Hydrothermal alteration associated with porphyry-style mineralisation typically comprises concentric near-circular alteration zones surrounding a roughly circular central intrusion. The intrusion itself and the proximal alteration zone is usually associated with positive magnetic anomalies whilst the outer alteration zones are much less magnetic. Because the country rocks are usually magnetic, this pattern of alteration produces a central magnetic 'high' surrounded by an annular magnetic 'low'.
This detection method locates and outlines sub-circular zonation patterns in the magnetic data that are associated with the central intrusion and inner alteration zone of the porphyry system. Specifically, it uses a circular feature detection method to locate sub-circular anomalies. Next, their boundaries are traced using deformable splines that are drawn to the locations of maximum contrast between the amplitudes of the central 'high' and surrounding area of lower magnetisation. While it is most useful in detecting copper (Cu) and gold (Au) porphyries in covered or magnetic terrains, it is a generic tool that is suitable for other circular feature identification.
Use the CET Porphyry Detection Extension to:
The porphyry detection process involves a three stage sequential approach.
Circular feature transform
The circular feature detection process consists of two steps. The Circular Feature Transform (CFT) highlights the locations of circular features within the data. The Central Peak Detection algorithm is then used to find the centres of the circular features highlighted by the circular feature transform output.

Amplitude contrast transform
The Amplitude Contrast Transform (ACT) emphasises the boundaries of circular features. Whilst the CFT is specific in detecting the centres of circular features, the ACT is used for locating the rim of the circular feature. In effect, the boundaries of circular features are revealed as 'halos' in the ACT output.

Boundary tracing
The Boundary Tracing tool is useful for outlining detected porphyry-like features. This approach utilises output from both the Central Peak Detection and Amplitude Contrast Transform. It uses deformable splines to converge to the feature boundaries highlighted by the ACT output. The output provides indicative geometry of the feature boundaries.

This new extension was developed by innovative collaborative research between Barrick Gold who initiated and funded the original research and the Centre for Exploration Targeting (CET) based at the University of Western Australia. The CET Porphyry Analysis Extension is licensed and distributed by Geosoft as an Oasis montaj plus third party extension.
Compudrape
Compudrape performs height continuation on aeromagnetic profile data to transform it from the original magnetic field on an arbitrary observation surface to the magnetic field on a new surface of specified height. The primary uses are to drape barometric or loose drape surveys to a tight drape, drape over the basement surface, transform drape-flown surveys to barometric and apply height corrections to minimize line-to-line effects.
In areas with steep topography it is difficult for survey aircraft to maintain a constant nominal height on the land. This causes large variations in the distance between the magnetic sensor and the ground (from 100 to 1000 m.), making it very difficult to process the data.
Compudrape corrects this effect by generating a magnetic grid that simulates the result that had been reached if the airplane had maintained a constant height.
The extension includes 1D and 2D functionality. The 1D function is most useful for removing the effects of variation in terrain clearance from line-to-line and/or at traverse-tie line intersections.
Compudrape was designed to perform loose drape or barometric to drape transformation as its primary task, so the elevation channel is the magnetic sensor elevation above sea level. The topography channel is the topography (i.e., sensor terrain clearance above ground subtracted from sensor elevation above sea level). The new observation height value is the desired constant drape height above ground.
To perform a drape to barometric transformation, elevation and topography channels change their meaning. The elevation channel is now a channel of the sensor terrain clearance (i.e., the radar altimeter channel). The topography channel is sea level (i.e., the channel contains constant values of 0). The new observation height value is the serried constant barometric altitude above sea level.
Use Compudrape to:
Compudrape was developed by the Paterson, Grant & Watson Limited. It is licensed and distributed by Geosoft as an Oasis montaj plus third party extension.
Gravity and Magnetic Filtering
The Gravity and Magnetic Filtering extension to Oasis montaj provides a Continuous Reduction to the Pole function for creating a grid that is reduced to the pole everywhere. The extension also enables you to calculate Total Magnetic Field from Measured Horizontal Gradients.
The Oasis montaj MAGMAP Filtering extension is required to run this extension.
Use the Gravity and Magnetic Filtering extension to:
Technical reference: Nelson, J. Bradley, Leveling - total field aeromagnetic data with measured horizontal gradients, Geophysics, vol.59, no.8 July, 1994, p.1166-1170.
Gravity and Magnetic Filtering was developed by the Paterson, Grant & Watson Limited. It is licensed and distributed by Geosoft as an Oasis montaj plus third party extension.
PotentQ
The PotentQ extension provides rapid semi-automatic modelling of a single magnetic and/or gravity anomaly.
PotentQ is a simplified and streamlined version of Potent, the Geophysical Software Solutions (GSS)'s mainstream potential field modelling tool. The model consists of a single body chosen from one of seven possible geometries.
Speed is achieved through close integration with Geosoft Oasis montaj. A highly streamlined modelling interface builds on the simplicity arising from the single anomaly/single body configuration. A specially formulated inversion scheme generally requires no user intervention.
Use PotentQ to:
PotentQ Modelling was developed by the Geophysical Software Solutions (GSS). It is licensed and distributed by Geosoft as an Oasis montaj plus third party extension
Praga 4 Radiometrics

The use of whole-spectrum information is consistent with the latest developments in the theory and instrumentation of gamma-ray spectrometry. The full-spectrum technique within the Praga Radiometrics extension includes a complete system of spectrum background removal. Aircraft, cosmic and radon background components can be separately adjusted by the user with the control of experimental calibration constants.
Visual control over various spectrum operations is an important feature. Using the spectrum browser, data can be displayed and analyzed on a spectrum-by-spectrum basis, allowing the user to evaluate the applicability of special processing methods such as spectrum-fitting or principal component analysis. There is a choice of relative (count rate) or absolute (activity, exposure and dose rates) outputs for all window, spectrum-fitting and principal component/window techniques. Another key aspect is the integration of the gamma-ray processing application with a gridding profile/grid viewer capability, for challenging tasks such as radon removal and man-made nuclide detection where multiple processing cycles are usually necessary.
Praga Radiometrics includes these five components:
Pico-Radiation-Air-to-Ground-Algorithm (Praga) software was developed by the Pico Envirotec and Spectronica. It is licensed and distributed by Geosoft as an Oasis montaj plus third party extension.
Predictive Targeting

The Predictive Targeting with Neural Networks extension provides a set of Oasis montaj GXs for training, simulation and target generation, as well as a comprehensive tutorial.
The process works on gridded data, and requires these three stages:
The simulation results may then be gridded, windowed and scaled within Oasis montaj, to highlight the new targets of interest.
This approach provides for the integration of a wide range of data types (e.g. geology, geophysics, geochemistry, remote sensing, topography) for robust and unbiased generation of exploration targets.
Predictive Targeting with Neural Networks was developed by the Paterson, Grant & Watson Limited. It is licensed and distributed by Geosoft as an Oasis montaj plus third party extension.